In this article, we discuss the findings of Aquant's 2022 Service Intelligence Benchmark Report and look at some key observations about service performance from the customer's perspective.
ARCHIVE FOR THE ‘aquant’ CATEGORY
Jan 07, 2022 • Features • Digital Transformation • technology • Aquant • GLOBAL • customer experience
In this article, we discuss the findings of Aquant's 2022 Service Intelligence Benchmark Report and look at some key observations about service performance from the customer's perspective.
The last two years were extremely difficult for the service industry—and not just because of the pandemic. While COVID-19 certainly played a role in exacerbating the issues, workforce labor shortages, complicated equipment, and increasingly reactive service were also challenges faced by many service providers.
And yet, according to the data analyzed in Aquant’s 2022 Service Intelligence Benchmark Report, there is another overarching theme to be found: the way organizations provide service today is not in tune with customer expectations. Six million tickets later, the report reveals some key observations about service performance from the customer’s perspective.
Our report measures data across:
- 76 organizations, including service divisions within OEMs and third-party service organizations across manufacturing, medical devices, capital equipment, HVAC, commercial appliances, and more
- More than 6 million work orders
- More than 31,000 technicians
- $7 billion total in service costs
- An average of 3 years of service data per company
We analyzed:
- How service organizations and their workforce measure up against industry benchmarks
- Why hitting your KPIs rarely equates to outstanding customer experiences
- Why a missed First Time Fix (FTF) event leads to a spiraling negative impact
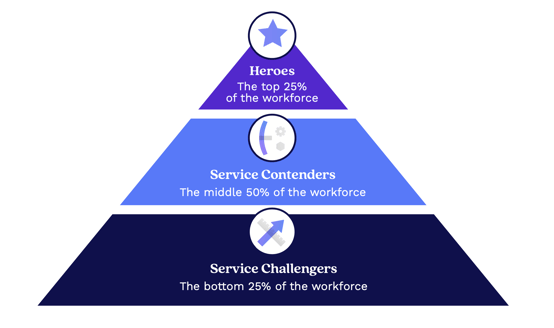
- How a workforce shortage has exacerbated the existing skills gap between the heroes (highest performers) and challengers (lowest performers) within each organization
Here's what we discovered:
- Service organizations suffer from a wide customer experience (CX) gap. First Time Fix (FTF) rates are one of the biggest contributors to CX gaps, or the difference between what customers expect and what your organization delivers. Our analysis shows that companies who measure FTF rates in 7-day or 14-day windows have artificially inflated FTF rates, and are setting the stage for a wide experience gap. That's the perfect setup for frustrating customer experiences. The moral of the story: a few metrics can’t provide the entire picture—and it’s time to look at experience as a whole.
- The knowledge gap between heroes and challenges is becoming more expensive. In 2021, service organizations faced even larger hiring challenges than in the past. This has left the industry with tens of thousands of unfilled jobs, and caused service costs to increase.
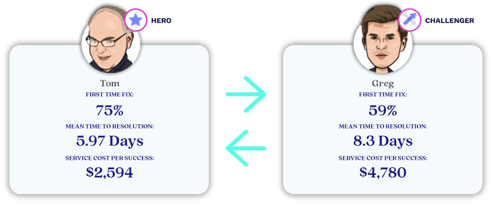
- The bottom quarter of the workforce costs organizations 84% more than the top quarter. That’s 4% higher than last year.
- The top 20% of the workforce (service heroes) has a 75% FTF rate.
- The bottom 20% of the workforce (service challengers) has a FTF rate of 59%.
- It’s possible to overcome these challenges. Your data tells a bigger story—if you know what to look for. Looking beyond your KPIs will help you tailor service for every customer, provide a better CX, upskill your team, and cut costs.
It’s time to understand your business on a much deeper level than ever before. Download Aquant’s 2022 Benchmark Report to see how you stack up to your peers, uncover the stories that your KPI averages are telling, and start seeing your service from the customer’s perspective.
Further Reading:
- Read more about Digital Transformation @ www.fieldservicenews.com/digital-transformation
- Read more about Aquant on Field Service News @ www.fieldservicenews.com/aquant
- Download Aquant's 2022 Benchmark Report @ www.aquant.io/resources/benchmark-report/
- Find out more about Aquant @ www.aquant.io
- Follow Aquant on Twitter @ twitter.com/Aquant_io
- Follow Aquant on LinkedIn @ www.linkedin.com/aquant.io
Nov 25, 2021 • Features • Digital Transformation • Aquant • Covid-19 • customer experience
Aquant, has recently published the 2022 Service Intelligence Benchmark Report, now available at Field Service News, which offers an in-depth analysis of field service performance and customer satisfaction in a year of talent shortage, COVID service...
Aquant, has recently published the 2022 Service Intelligence Benchmark Report, now available at Field Service News, which offers an in-depth analysis of field service performance and customer satisfaction in a year of talent shortage, COVID service pivots, and shifting customer demands. In this final excerpt from the report, we discuss how companies can look beyond KPIs.
This feature is just one short excerpt from a report published by Aquant
www.fieldservicenews.com subscribers can read the full report now by hitting the button below.
If you are yet to subscribe you can do so for free by hitting the button and registering for our complimentary subscription tier FSN Standard on a dedicated page that provides you instant access to this white paper PLUS you will also be able to access our monthly selection of premium resources as soo as you are registered.
 Data usage note: By accessing this content you consent to the contact details submitted when you registered as a subscriber to fieldservicenews.com to be shared with the listed sponsor of this premium content Aquant who may contact you for legitimate business reasons to discuss the content of this white paper, as per the terms and conditions of your subscription agreement which you opted into in line with GDPR regulations and is an ongoing condition of subscription.
The Customer Experience Gap
The Customer Experience Gap shows the difference between what customers expect and what your organization delivers.
Our analysis shows that companies who measure FTF rates in 7-day or 14-day windows are setting the stage for a wide experience gap—which leads to frustrating customer experiences. The moral of the story: a few metrics can’t provide the entire picture. It’s time to look at experience as a whole.
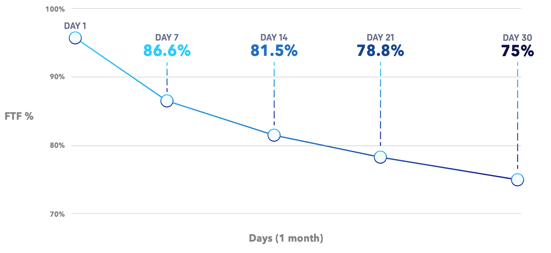
Instead of defining FTF in arbitrary time increments (7 days, 14 days, or 21 days), think about it in terms of the natural service cycle. Our research shows that measuring in 30-day windows strips out false-positive FTF rates.
Understand where your organization falls on the Customer Experience Gap chart.
- If your FTF rate is similar when measured at 7 days and 30 days, you have a small gap.
- If your FTF rate has a wide variation (usually a high rate at 7 days and a low rate at 30 days), you have a large gap.
- If you have a large gap, your team is focused on hitting their numbers instead of focusing on great customer experiences.
Why FTF Rates Vary by Time
When measured in short windows (like 7-day increments), jobs where a technician made an incorrect fix—but got the machine to work temporarily—will be marked as complete. But an incorrect fix is only a temporary measure, and the machine will continue to break down until properly repaired. For instance, a customer may call for service two or three times in a 30-day window. If you only measure in 7-day increments, your dashboard may show you successfully completed three jobs for one customer. In reality, these were three failed visits. This environment also leads to customer escalations and customer complaints that management may deem as “surprise complaints” that they didn’t see coming.
When it comes to service, it’s just as important to maximize the time between events and failures as it is to fix things correctly the first time. The less a customer needs a technician on-site, the better. This means the customer’s needs are being met.
Two Examples of Poor Customer Experiences
Company A: KPIs are not aligned to customer outcomes
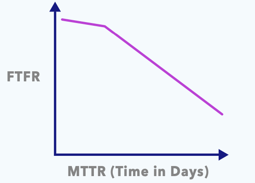
When FTF curves start out flat, it means that the company likely incentivizes high FTF rates over deep problem-solving. That’s shown by the curve getting steeper at the end of a 30-day cycle, indicating that the FTF rate is plummeting.
The key takeaway: Company A is not closely monitoring FTF rate—or there is no incentive to maintain a high rate over a long period of time—leading to poor customer experiences.
Company B: KPIs are not aligned to customer outcomes
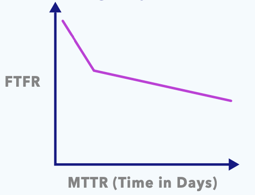
Here, the FTF rate starts out high and eventually flattens out. This may indicate that more preparation, information, or triage was needed before visiting a job site. A return visit would most likely be required to successfully solve the problem. Unlike Company A, Company B eventually solves root problems, but it requires several visits.
The key takeaway: Company B is trying to provide great customer service, but has some limitations that hinder quick and accurate outcomes, such as a lack of prep or an employee knowledge gap.
The Skills Gap - A Profile of the Top and Lowest Performing Organisations
What does the knowledge gap have to do with hitting KPIs?
If there is a large knowledge gap between team members, performance will vary—and so will customers’ experiences. That’s why it’s crucial to make sure that your technicians are equally knowledgeable about the equipment that they service and up-to-date on specific customer preferences.
Determine your team’s skills gap.
To increase your team’s knowledge and success, you must first identify how much of a gap exists between your star technicians (heroes) and underperformers (challengers).
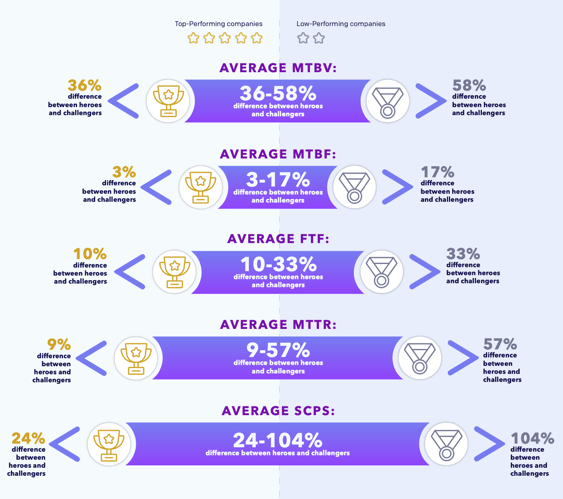
For this report, we calculated the percentage difference between heroes and challengers across all organizations on the following page. We divided it into:
- Above average organizations
- Above performing organizations
- Below average organizations
A Snapshot of high performing and low performing organizations
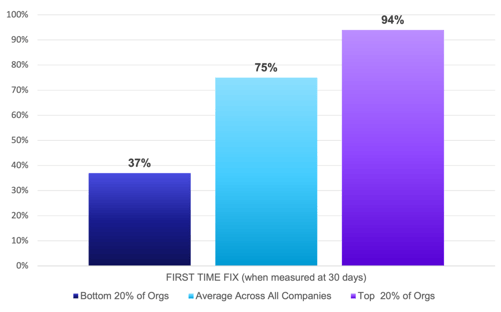
The top 20% of organizations have a smaller workforce skills gap. A workforce with a more equal knowledge distribution results in more consistent customer experiences.
Why the Skills Gap Matters
A bigger distance between heroes and challengers leads to:
- Decrease in customer satisfaction
- Increased workload on your already overburned experts
- Increase in service costs
- Less capacity for organizational resilience
- Negative impact on growth
What's Next?
The service industry is facing unprecedented workforce shortages and increasing customer demands. A better way to overcome these challenges is to understand your business on a much deeper level than you do today so you can tailor service for every customer. Here’s where to start.

This feature is just one short excerpt from a report published by Aquant.
www.fieldservicenews.com subscribers can read the full report now by hitting the button below.
If you are yet to subscribe you can do so for free by hitting the button and registering for our complimentary subscription tier FSN Standard on a dedicated page that provides you instant access to this white paper PLUS you will also be able to access our monthly selection of premium resources as soo as you are registered.
 Data usage note: By accessing this content you consent to the contact details submitted when you registered as a subscriber to fieldservicenews.com to be shared with the listed sponsor of this premium content Aquant who may contact you for legitimate business reasons to discuss the content of this white paper, as per the terms and conditions of your subscription agreement which you opted into in line with GDPR regulations and is an ongoing condition of subscription.
Further Reading:
- Read more about Aquant on Field Service News @ www.fieldservicenews.com/aquant
- Read more about Digital Transformation @ www.fieldservicenews.com/digital-transformation
- Read more about Leadership & Strategy @ www.fieldservicenews.com//leadership-and-strategy
- Learn more about Aquant @ www.aquant.io
- Follow Aquant on Twitter @ twitter.com/Aquant_io
Nov 18, 2021 • Features • Digital Transformation • Aquant • Covid-19 • customer experience
Aquant, has recently published the 2022 Service Intelligence Benchmark Report, now available at Field Service News, which offers an in-depth analysis of field service performance and customer satisfaction in a year of talent shortage, COVID service...
Aquant, has recently published the 2022 Service Intelligence Benchmark Report, now available at Field Service News, which offers an in-depth analysis of field service performance and customer satisfaction in a year of talent shortage, COVID service pivots, and shifting customer demands. In this excerpt from the report, we look at what KPIs do and don't tell us.

This feature is just one short excerpt from a report published by Aquant
www.fieldservicenews.com subscribers can read the full report now by hitting the button below.
If you are yet to subscribe you can do so for free by hitting the button and registering for our complimentary subscription tier FSN Standard on a dedicated page that provides you instant access to this white paper PLUS you will also be able to access our monthly selection of premium resources as soo as you are registered.
 Data usage note: By accessing this content you consent to the contact details submitted when you registered as a subscriber to fieldservicenews.com to be shared with the listed sponsor of this premium content Aquant who may contact you for legitimate business reasons to discuss the content of this white paper, as per the terms and conditions of your subscription agreement which you opted into in line with GDPR regulations and is an ongoing condition of subscription.
WHAT KPI MEASUREMENTS DO AND DON'T TELL US
KPIs don't equal customer sentiment
In the Service Leader’s Guide to Workforce KPIs, we examined why workforce measurement is more critical than ever, and we defined best practices for measurement criteria.
For the 2022 Service Intelligence Benchmark Report, we went a step further. We analyzed service data to understand service performance beyond KPI measurement. We found that knowing your KPIs—by number or average performance—is not the same as understanding what those numbers reveal about customer satisfaction, employee skill level, or overall service performance. Averages don’t disclose the specific details you need to make critical service decisions.
Service KPIs by the numbers
Here’s the breakdown of how service organizations measure up against other organizations and the industry as a whole.
FTFR - First Time Fix Rate
What is it?
First Time Fix rate is one of the most popular metrics for workforce measurement. It indicates how often someone is able to fix an issue on the first try. In this report, we are measuring the FTF rate of field visits, in a 30-day window.

Key Observation:
FTF rates have hovered around 75% for more than a decade—and remained stagnant for all but a handful of top-performing companies. Additionally, FTF rates should never be measured in isolation. On average, a failed first visit leads to 2.5 additional visits and 20 days for MTTR.
CPS - Cost Per Success
What is it?
The total amount required to successfully close a service ticket is known as the Cost Per Success (CPS). This is a bit different from other similar-sounding KPIs, such as Cost Per Truck Roll, since total CPS may include multiple visits, multiple truck rolls, a variety of parts, and other labor costs.
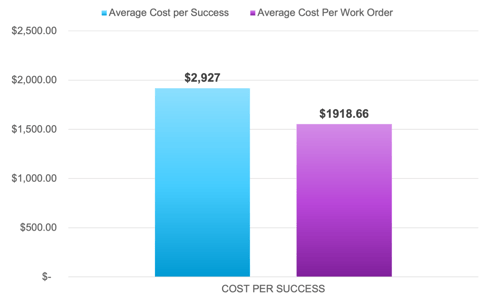
Some organizations may measure Cost Per Work Order, but that metric leaves out cases that include always assigning experts to the most complex (and expensive) jobs. Additionally, it does not account for cases where multiple work orders are related to the same core issue.
Key Observation:
Successfully resolving an issue involves nearly 42% more in costs versus looking at work orders individually. While average costs are dependent on the company and type of equipment being serviced, the cost difference is the most important to keep in mind.
MTTR - Mean Time to Resolution
What is it?
The Mean Time to Resolution KPI measures the time it takes to resolve a customer issue. Typically, it’s the time between the case creation date and the closure date. Similar to the pain of staying on hold when trying to resolve a personal issue, minimizing MTTR is a key factor in increasing positive customer experiences and reducing service costs. In the last year, we’ve seen a growing divide in this metric.
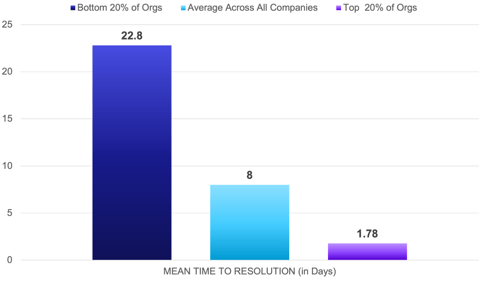
MTTR (in days):
• 8 days: average across all companies• 1.78 days: top 20% of organizations• 22.8 days: bottom 20% of organizations
MTBF - Mean Time Between Failures
What is it?
Mean Time Between Failures quantifies the average time between customer issues. Service organizations try to maximize this metric because a higher rate represents excellent service quality and maximum uptime.
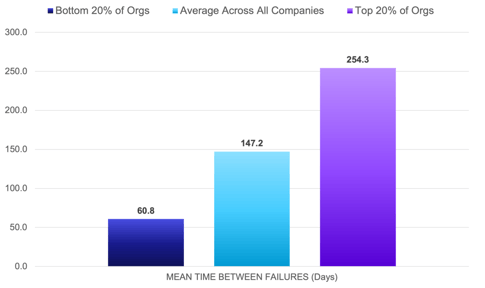
• 139.9 days: Average across all companies (147.2 in 2021)
• 231.8 days: Top 20% of organizations (254.3 in 2021)
• 57.5 days: Bottom 20% of organizations (60.8 in 2021)
Key Observation:
Individual pieces of equipment may have differing life cycles, but service leaders need to understand underlying patterns—in both their machines and workforces. When visiting a job site, experienced service heroes know how to use their time wisely and ensure that assets are working properly before leaving. This can significantly extend the time between failures.
MTBV - Mean Time Between Visits
What is it?
Need to calculate both uptime and service performance? Look no further than the Mean Time Between Visits metric. This measures every visit you have for an asset or customer, instead of only tracking time between failures.
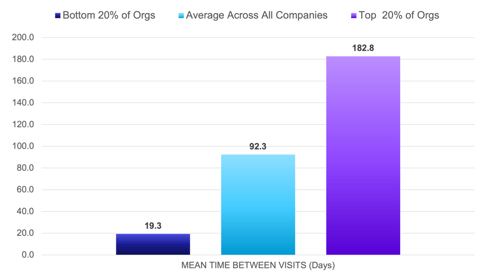
• 92.3 days: average across all companies
• 182.8 days: top 20% of organizations
<• 19.28 days: bottom 20% of organizations
Key Observation:
Experienced techs will skew towards longer time intervals between visits. That’s great news, thanks to low repeat visit rates, as well as their ability to utilize every visit to maximize uptime.

This feature is just one short excerpt from a report published by Aquant.
www.fieldservicenews.com subscribers can read the full report now by hitting the button below.
If you are yet to subscribe you can do so for free by hitting the button and registering for our complimentary subscription tier FSN Standard on a dedicated page that provides you instant access to this white paper PLUS you will also be able to access our monthly selection of premium resources as soo as you are registered.
 Data usage note: By accessing this content you consent to the contact details submitted when you registered as a subscriber to fieldservicenews.com to be shared with the listed sponsor of this premium content Aquant who may contact you for legitimate business reasons to discuss the content of this white paper, as per the terms and conditions of your subscription agreement which you opted into in line with GDPR regulations and is an ongoing condition of subscription.
Further Reading:
- Read more about Aquant on Field Service News @ www.fieldservicenews.com/aquant
- Read more about Digital Transformation @ www.fieldservicenews.com/digital-transformation
- Read more about Leadership & Strategy @ www.fieldservicenews.com//leadership-and-strategy
- Learn more about Aquant @ www.aquant.io
- Follow Aquant on Twitter @ twitter.com/Aquant_io
Nov 11, 2021 • Features • Digital Transformation • Aquant • Covid-19 • customer experience
Aquant, has recently published the 2022 Service Intelligence Benchmark Report, now available at Field Service News, which offers an in-depth analysis of field service performance and customer satisfaction in a year of talent shortage, COVID service...
Aquant, has recently published the 2022 Service Intelligence Benchmark Report, now available at Field Service News, which offers an in-depth analysis of field service performance and customer satisfaction in a year of talent shortage, COVID service pivots, and shifting customer demands.

This feature is just one short excerpt from a report published by Aquant
www.fieldservicenews.com subscribers can read the full report now by hitting the button below.
If you are yet to subscribe you can do so for free by hitting the button and registering for our complimentary subscription tier FSN Standard on a dedicated page that provides you instant access to this white paper PLUS you will also be able to access our monthly selection of premium resources as soo as you are registered.
 Data usage note: By accessing this content you consent to the contact details submitted when you registered as a subscriber to fieldservicenews.com to be shared with the listed sponsor of this premium content Aquant who may contact you for legitimate business reasons to discuss the content of this white paper, as per the terms and conditions of your subscription agreement which you opted into in line with GDPR regulations and is an ongoing condition of subscription.
In this comprehensive data report, Aquant analyzed how service organizations and their workforce measureD up against industry benchmarks.
We also explored service performance from a customer perspective. Aquant analyzed more than six million service tickets to reveal:
-
A snapshot of the overall industry and how companies measure up against each other
-
The reason why hitting your KPIs rarely equates to outstanding customer experiences
-
The spiraling impact of a missed First Time Fix (FTF) event
-
An increase in the workforce skills gap
-
COVID-19’s impact on service
We provide recommendations to:
-
Start making immediate business improvements by looking at service performance in a comprehensive way
-
Boost the customer experience in the short-term and long-term
-
Upskill a team in the face of a talent shortage
-
Succeed amid post-Covid service disruptions
KEY FINDINGS
KPIs Are Only as Meaningful As How You Measure Them
First Time Fix is a Distorted Barometer of Service Quality
Organizations that monitor KPIs in isolation may think they are hitting their numbers and providing great service. However, there’s a good chance that they are providing sub-par customer experiences.
Organizations that measure FTF rates at seven days or 14 days actually have much lower long-term success rates than their dashboards reveal. This is because fixes marked as complete on day one often require additional visits on day two through day 14 to fix a persistent problem that may have been incorrectly or inadequately addressed on the first visit. For example, if you wrap a leaking hose with duct tape to stop a leak, you’ve put a bandaid on a problem without fixing the root issue. The customer may call to reopen that ticket when they discover another leak in the following week.
-
86.6% is the FTF rates when measured in 7-day windows
-
81.5% is the FTF rates when measured in 14-day windows
-
75% is the FTF rates when measured in 30-day windows
The other argument against relying too heavily on FTF rates is that high values often mask other issues, such as:
-
Employees who shotgun parts to hit KPIs
- High labor costs due to labor to over-reliance on industry veterans
The way organizations provide service today is not in tune with customer expectations. Even with an average FTF rate, one in every four jobs requires at least one repeat visit.
Variations on FTF measurements are one reason for the disconnect. Other contributing factors include:
- Lack of insights into an organization’s core health
- A workforce labor shortage
- Inability to connect the dots between service performance and customer experience
- Reactive vs. proactive service
In 2021, service organizations faced even larger hiring challenges than in the past. This has left the industry with tens of thousands of unfilled jobs, and some reports estimate there will be an industry-wide shortage of three million skilled trade workers in the next five years.
-
The bottom quarter of the workforce costs organizations 84% more than the top quarter. That’s 4% higher than last year.
-
- The top 20% of the workforce (service heroes) has a 75% FTF rate. The bottom 20% of the workforce (service challengers) has a FTF rate of 59%.
Mean Time to Resolution (MTTR) increased during COVID, showing that jobs were completed faster. Part of that increase is attributed to more service organizations adopting remote resolution technology. This technology helps customers address minor issues themselves through self-service solutions. It also enables service organizations to diagnose—and even repair—issues without the need to send a tech on-site, thus reducing time and costs.
This is also a sign of resiliency across service organizations, many of whom were able to adapt in the face of ever-changing circumstances.
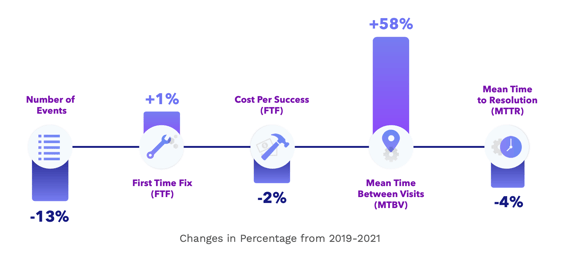
The insights in this report, gleaned from actual service data, provides a path to service improvements through a multi-step process.
-
Learn how to accurately identify your organization’s core service problems by better understanding the patterns in your service data
-
Use those data patterns to drive actionable service recommendations—for management-level decisions and in-the-field fixes
-
Plan proactive customer experience enhancements
-
Make more informed workforce training and hiring decisions to shrink the skills gap
How We Compiled the Data
Aquant gathered and analyzed actual anonymized service data from more than 76 leading service organizations. The data in this report was measured before an organization deployed Aquant’s AI solution.
The report measures:
- 76 organizations, including service divisions within OEMs and third- party service organizations across manufacturing, medical devices, capital equipment, HVAC, commercial appliances, and more
- More than 6 million work orders
- More than 31,000 technicians
- $7 billion total in service costs
- An average of 3 years of service data per company
 How We Define the Service Workforce
 How is this Report Different from Standard Service Benchmarks?
• We analyzed real service data to understand the health and outlook of organizations instead of relying on service executives to self-report KPIs. Data sources included service tickets, CRM data, parts information, and more.
• We charted the skills gap. This makes it easy to extrapolate how much an organization can gain in efficiency and cost savings if the entire workforce was able to perform more like your experts.
• We analyzed the data using the Aquant Service Intelligence Platform, which includes a Natural Language Processing (NLP) engine built for the service industry. This lets us dig deep into data ranging from CRM and parts inventory to service tickets, handwritten records, and other information that never makes it into any databases. We are able to draw out patterns and recommendations based on raw data.

This feature is just one short excerpt from a report published by Aquant.
www.fieldservicenews.com subscribers can read the full report now by hitting the button below.
If you are yet to subscribe you can do so for free by hitting the button and registering for our complimentary subscription tier FSN Standard on a dedicated page that provides you instant access to this white paper PLUS you will also be able to access our monthly selection of premium resources as soo as you are registered.
 Data usage note: By accessing this content you consent to the contact details submitted when you registered as a subscriber to fieldservicenews.com to be shared with the listed sponsor of this premium content Aquant who may contact you for legitimate business reasons to discuss the content of this white paper, as per the terms and conditions of your subscription agreement which you opted into in line with GDPR regulations and is an ongoing condition of subscription.
Further Reading:
- Read more about Aquant on Field Service News @ www.fieldservicenews.com/aquant
- Read more about Digital Transformation @ www.fieldservicenews.com/digital-transformation
- Read more about Leadership & Strategy @ www.fieldservicenews.com//leadership-and-strategy
- Learn more about Aquant @ www.aquant.io
- Follow Aquant on Twitter @ twitter.com/Aquant_io
Nov 04, 2021 • Features • Digital Transformation • technology • Aquant • GLOBAL
In this article from Aquant, we look at three tips to secure approval for new service projects and how to make the right decision for your organisation.
In this article from Aquant, we look at three tips to secure approval for new service projects and how to make the right decision for your organisation.
How to Make the Right Decision For Your Organisation
Artificial intelligence is becoming an essential tool for the service sector — aiding in everything from service delivery and customer support, to employee training.
With nearly 50% of companies reporting that they’ve adopted AI in at least one business function, trends indicate that tech-forward companies are past figuring out if they should lean on AI’s capabilities. Instead, they’re figuring out when they’ll make the investment and how they will implement it.
As companies weigh the pros and cons of adoption, an even bigger question arises: is it better to build a solution in-house or buy it from a vendor?
Ultimately, the questions you should consider are:
· Which option delivers maximum organizational benefit?
· What is the difference in deployment time for building vs. buying?
· How much will it cost to build vs. buy?
· What internal resources or additional consultants will be needed for each option?
· If a quick-to-implement solution fits your organization’s needs, will it offer better ROI in comparison to building a perfect, custom solution that may take twice as much time and resources?
It’s about what offers the biggest benefit to your organization. Here are a few expert tips for figuring out which path is the best fit.
Building an AI Solution
Pros:
● Customization: You can reduce overhead costs by building a solution that’s just right for your company, skipping any unnecessary features.Buying an AI Solution
Pros:
● Cost Effective: AI vendors are the experts. They already have a dedicated/established team and the knowledge needed to pull off a huge launch — no outsourcing necessary.I've made a decision. What's next?
Once you’ve made your choice in the age-old buy-or-build debate, the next step is to get your stakeholders on board. Luckily, we wrote the blueprint for success.
Check out our latest eBook, How to Secure Buy-In for Service Transformation Projects, for expert recommendations on getting even the most skeptical executives to see your AI vision.
Further Reading:
- Read more about Digital Transformation @ www.fieldservicenews.com/digital-transformation
- Read more about Aquant on Field Service News @ www.fieldservicenews.com/aquant
- Learn more about AI on Field Service News @ www.fieldservicenews.com/artificial-intelligence
- Find out more about Aquant @ www.aquant.io
- Follow Aquant on Twitter @ twitter.com/Aquant_io
- Follow Aquant on LinkedIn @ www.linkedin.com/aquant.io
Oct 15, 2021 • Features • KPIs • Digital Transformation • Aquant • GLOBAL
Relying solely on average service KPIs may be risky for service organizations, since they do not really capture the overall customer experience. In this new article from Aquant, leading Service Intelligence Platform, we discuss why it pays to...
Relying solely on average service KPIs may be risky for service organizations, since they do not really capture the overall customer experience. In this new article from Aquant, leading Service Intelligence Platform, we discuss why it pays to have a bird's eye view of your service landscape.
At some point in time, most service organizations will receive a complaint that they likely weren’t aware of. But whether the call was the result of compounded dissatisfaction or related to a specific incident, there are ways to prevent customer escalations before a complaint arises—and it starts with taking a close look at your performance trackers.
Your org may be using a variety of data points, including KPIs like First Time Fix Rate, Cost Per Success and Net Promoter Score, to measure the success of your products, services, and processes. But relying solely on average service KPIs can be risky: they don't fully measure the total customer experience.
KPIs and NPS are not always what they seem, especially if you don’t have a complete look at your service landscape. It is helpful to think beyond basic First Time Fix Rate (FTFR), Cost Per Success (CPS), Mean Time to Resolution (MTTR), and Mean Time Between Fixes (MTBF) rates when looking to get an accurate snapshot of your service performance and costs.
We can’t begin to understand how to proactively improve service performance unless we have an excellent understanding of the landscape as a whole — including everything from specific field tech performance to machine usage and breakdown rates. It all starts with establishing baseline measurements, or snapshots of your service habits and outcomes as they stand.
To form these measurements, you need to take a close look at your organization’s data, sifting through a large pool of numbers to spot hidden patterns—including areas of celebration or concern. This type of assessment can help you set priorities, determine which practices you want to keep or improve, and get you into the practice of keeping tabs on your KPIs.
When you take an in-depth look at your KPIs, you begin to spot other factors that may look like your customer is happy when they actually aren’t. For instance, imagine that one of your all-star techs retires. They have been servicing an important account for years, and KPIs indicate A+ service. A less-seasoned technician inherits the account, but due to a lack of experience, the KPIs have started dwindling and the client calls with a complaint. When you go on to review the 12-month average, you can’t pinpoint exactly where the issue is because the data is now skewed. This is where it becomes important to look at trends across the entire service period—including the time that your new tech took over—so that you can brainstorm solutions to get your account up to speed (additional training, reassignment, etc.)
“If customer focus is not at the forefront of our business on a daily basis, we put ourselves at risk of losing and jeopardizing relationships with them,” said Sidney Lara, Aquant’s resident service expert, in a recent session, 3 Ways to Win Customer Loyalty and Avoid Service Disasters. “It’s all about allowing service leaders to be quicker about identifying issues in the field and quicker about maximizing retention and customer satisfaction.”
Improve Indicators That Aren't Performing Well
Take the Next Steps to Greatness
Do you know where your company’s current practices stand in comparison to its peers?
Find out how your service performance stacks up by taking our quick service assessment. Get actionable tips based on your results to reduce service costs, boost your CX, and become one of the top 20% of service organizations.
Further Reading:
- Read more about Digital Transformation @ www.fieldservicenews.com/digital-transformation
- Read more about Aquant on Field Service News @ www.fieldservicenews.com/aquant
- Learn more about Service KPI's and on Field Service News @ www.fieldservicenews.com/blog/kpis
- Find out more about Aquant @ www.aquant.io
- Follow Aquant on Twitter @ twitter.com/Aquant_io
- Follow Aquant on LinkedIn @ www.linkedin.com/aquant.io
Oct 07, 2021 • News • Artificial intelligence • Digital Transformation • technology • Aquant • GLOBAL
Aquant, the leading Service Intelligence Platform that gives service leaders, reps and teams the most vital information they need for every situation, has raised $70 million in Series C funding. The investment will support the growth and advance its...
Aquant, the leading Service Intelligence Platform that gives service leaders, reps and teams the most vital information they need for every situation, has raised $70 million in Series C funding. The investment will support the growth and advance its industry-leading service intelligence technology.
The funding round was led by Qumra Capital, Insight Partners and Pitango Growth. Previous investors Lightspeed Venture Partners and Angular Ventures also participated in the round, along with new investors Schneider Electric Ventures and Claltech.
Aquant has now raised a total of $110 million. The company will use the fresh capital to support its rapid growth and expand use cases as it strengthens its position as the service intelligence leader in every market for every company that provides service. To accelerate its global expansion, Aquant will grow its engineering, client services and go-to-market teams, adding positions in the US, Europe and Israel. The funding will also drive the continuous innovation of its Artificial Intelligence platform, including the development of cutting-edge technology that combines structured and unstructured data and harnesses the tribal knowledge of experts.
AQUANT'S RAPID GROWTH IS A DIRECT RESULT OF HOW IT'S HELPING COMPANIES OF ALL SIZES MAKE THESE TRANSFORMATIVE CHANGES.
“To win the service game today, it’s not enough to just solve problems anymore,” said Shahar Chen, CEO and co-founder of Aquant. "Companies must also provide a stellar service experience. And when providing a stellar experience, service becomes more than just 'maintenance' for customers – it becomes magic.” Using deep service expertise and specialized Natural Language Processing (NLP), Aquant understands all service data, combines it with tribal knowledge, and provides service leaders, technicians, and reps with the most vital information they need, exactly when they need it. Service has largely remained the same for decades, but is now at a turning point. Companies are seeking to transform the way they deliver service, with service leaders expected to deliver exceptional service to differentiate the brand. They are also being asked to provide customer insights, derived from service data, to help executives and front line managers make strategic business decisions across all lines of business, including service, product development, sales, and more.
Aquant’s rapid growth is a direct result of how it’s helping companies of all sizes make these transformative changes. The company gives service leaders needed insights into their business, enabling them to make proactive, data-driven decisions, identify at-risk customers, understand asset performance, identify compliance risks, and more. The AI-powered technology is also helping to erase the talent shortage by providing the entire workforce access to information that was previously siloed in databases or held in the minds of long-tenured technicians.
Leading market researchers like Gartner Research have noted the unfulfilled need to leverage service intelligence throughout the industry, citing the powerful potential of machine learning and data mining to increase field service efficiency.
Aquant’s proprietary service intelligence platform harnesses Artificial Intelligence to ingest unstructured data, tribal knowledge, and industry insights. This combination gives service leaders meaningful insights into the state of their organization, enabling them to make data-driven decisions. It also empowers service technicians to be at the right place with the right knowledge and the right parts at the right time to solve technical problems immediately. Making every Aquant-powered customer experience a magical service interaction.
“Aquant is revolutionizing service intelligence and is well-positioned to lead this large market given their domain expertise and data savviness. Their technology enables companies to focus on what they’re good at, alleviating one of the most serious business challenges today,” said Sivan Shamri Dahan, managing partner at Qumra Capital. “We’re very excited to partner with them as they continue their rapid growth in order to significantly improve service experiences.”
Service intelligence solves an increasingly problematic talent shortage in the field service industry, providing new hires access to decades of technical knowledge, account data and service history at their fingertips. As Baby Boomers continue to retire from technician roles and younger Millennial and Generation Z employees fill their positions, sharing knowledge and employing data effectively will be increasingly important.
“Customers trust Aquant’s AI-enabled offering, as unlike generic AI solutions, it is tailored to the service vertical’s needs and delivers clear ROI from day one,” said Idit Muallem-Yedid, partner at Pitango Growth, who's joining Aquant's Board. “Aquant's insights shed light on areas traditionally perceived as blind spots in service operations and experience. I am excited to be part of Aquant’s journey, as it continues to bring value to all stakeholders of the service experience and roll out additional solutions highly anticipated by its customers.”
"We look forward to working with our new investors as we enter an important growth phase," said Assaf Melochna, president and co-founder of Aquant. "The service industry is on the cusp of once-in-a-lifetime advancements, and helping these companies transform service by providing critical business insights is built into Aquant's DNA." The company works across a number of industries, including medical device manufacturers, food equipment manufacturers, capital equipment manufacturers, industrial automation and appliances. Its clients include Siemens Healthineers, The Home Depot, 3D Systems, and Sysmex, among others.
Further Reading:
- Read more about Digital Transformation @ www.fieldservicenews.com/aquant
- Read more about Aquant on Field Service News @ www.fieldservicenews.com/aquant
- Read more about Artificial Inteeligence @ www.fieldservicenews.com/artificial-intelligence
- Learn more about Aquant @ www.aquant.io
- Follow Aquant on Twitter @ twitter.com/Aquant_io
Jul 29, 2021 • Features • Digital Transformation • Service Leadership • Aquant • customer experience
In this third and final excerpt from a recent white paper published by Aquant, we look at the possibilities that Artificial Intelligence opens to make accurate decisions based on concrete data.
In this third and final excerpt from a recent white paper published by Aquant, we look at the possibilities that Artificial Intelligence opens to make accurate decisions based on concrete data.
This feature is just one short excerpt from a white paper published by Aquant
www.fieldservicenews.com subscribers can read the full white paper now by hitting the button below.
If you are yet to subscribe you can do so for free by hitting the button and registering for our complimentary subscription tier FSN Standard on a dedicated page that provides you instant access to this white paper PLUS you will also be able to access our monthly selection of premium resources as soo as you are registered.
 Data usage note: By accessing this content you consent to the contact details submitted when you registered as a subscriber to fieldservicenews.com to be shared with the listed sponsor of this premium content Aquant who may contact you for legitimate business reasons to discuss the content of this white paper, as per the terms and conditions of your subscription agreement which you opted into in line with GDPR regulations and is an ongoing condition of subscription.
Business leaders are leaning into data-centric decision making as a way to move beyond simply tracking KPIs and determine if their services are actually providing customers with value. With the help of smart tools, you can depend less on instincts and theories, and use methods backed by actual insights to propel your business forward.
How do you know if you need a better way to analyze your business’ big picture? Start by taking a look at the way you currently measure customer value.
"If you currently lack the insight to draw specific conclusions,
it’s time to dig deeper into your data."
If you currently lack the insight to draw specific conclusions, it’s time to dig deeper into your data. To understand the root causes of issues, it’s essential to have the ability to look deeply into metrics — which is where AI becomes a powerful tool to have in your arsenal.
As AI absorbs and analyzes your data, it can provide predictive analytics that help you understand your customers’ behavior. AI provides deep insights and steers the decision-making process, becoming a mighty ally in the quest to maximize customer satisfaction and improve operations.
Ask Yourself:
-
How often does my organization receive customer feedback?
-
If a customer churned tomorrow, would we know why?
-
How do we currently prevent service disasters before they happen?
-
Does our company leverage tech to gain immediate customer feedback on services?
-
Are we using data to analyze the way our customers consume products?
Informed Decisions Lead to More Certain Outcomes
At its finest, AI opens new possibilities, giving you the power to make accurate decisions based on concrete data — not hypotheticals. It goes beyond showing you today’s metrics, guiding you and helping you understand all data relative to your goal. Seasoned business leaders know that while metrics may “unexpectedly” dip or miss the mark, there’s always a reason as to why. Instead of panicking, making assumptions, or instating ineffective countermeasures, it is far more accurate to look at the bigger picture to determine how you arrived at the final outcome.
With AI-powered insights, you become the driver and you control the truthful narrative. It’s time to get ahead of NPS, which offer an incomplete look at your business. If you want to strengthen your customer relationships and get an accurate measure of customer satisfaction, AI can help.
Be proactive instead of reactive. For instance, if your AI tool indicates a few less-than-ideal service moments, you can initiate communication with your customers instead of waiting for feedback to come your way. You can also proactively address customer dissatisfaction before waiting anxiously for the inevitable heated phone call, and you can take the opportunity to tell them what actions you’re taking to rectify the issues. On the other side of the coin, if you notice that your service performance is stellar, you can use that occasion to remind your customers why you’re the choice provider, which may even lead to some awesome upselling opportunities.
Clients and potential customers value transparency more than ever, and AI can bolster your ability to communicate. They will start seeing you as a trusted partner in business — a leader that’s fully vested in their success.
Conclusion
With Aquant’s Service Insights, organizations go beyond visualization and enter the realm of action. Unlike traditional BI tools, our products empower teams to solve their business problems by helping them to quickly analyze disparate data and get clear directions on what to do next.
Actionable feedback shows you what information is most relevant and helps direct you to make the right calls for your business. You can easily identify at-risk customers and address your service issues in real time — without the need for an on-site team of data scientists.
Backed by data from more than five million service tickets from manufacturers and service providers, Service Insights generates trends, industry benchmarks, and predictions that fit the context of your business.
You can also tap into hidden data to make more holistic decisions, and share insights and overviews that identify key statistics and important trends.
The best decisions are made with a 360-degree view, and traditional reporting is no longer enough. The decision to adopt AI is a big one, but it’s a tool that can change the trajectory of your business.

This feature is just one short excerpt from a white paper published by Aquant.
www.fieldservicenews.com subscribers can read the full white paper now by hitting the button below.
If you are yet to subscribe you can do so for free by hitting the button and registering for our complimentary subscription tier FSN Standard on a dedicated page that provides you instant access to this white paper PLUS you will also be able to access our monthly selection of premium resources as soo as you are registered.
 Data usage note: By accessing this content you consent to the contact details submitted when you registered as a subscriber to fieldservicenews.com to be shared with the listed sponsor of this premium content Aquant who may contact you for legitimate business reasons to discuss the content of this white paper, as per the terms and conditions of your subscription agreement which you opted into in line with GDPR regulations and is an ongoing condition of subscription.
Further Reading:
- Read more about Aquant on Field Service News @ www.fieldservicenews.com/aquant
- Read more about Digital Transformation @ www.fieldservicenews.com/digital-transformation
- Read more about Leadership & Strategy @ www.fieldservicenews.com//leadership-and-strategy
- Learn more about Aquant @ www.aquant.io
- Follow Aquant on Twitter @ twitter.com/Aquant_io
Jul 22, 2021 • Features • Digital Transformation • Service Leadership • Aquant • customer experience
In this second excerpt from a recent white paper published by Aquant, we discuss which methods are best for creating customer risk scorecards and managing workforce performance issues.
In this second excerpt from a recent white paper published by Aquant, we discuss which methods are best for creating customer risk scorecards and managing workforce performance issues.

This feature is just one short excerpt from a white paper published by Aquant
www.fieldservicenews.com subscribers can read the full white paper now by hitting the button below.
If you are yet to subscribe you can do so for free by hitting the button and registering for our complimentary subscription tier FSN Standard on a dedicated page that provides you instant access to this white paper PLUS you will also be able to access our monthly selection of premium resources as soo as you are registered.
 Data usage note: By accessing this content you consent to the contact details submitted when you registered as a subscriber to fieldservicenews.com to be shared with the listed sponsor of this premium content Aquant who may contact you for legitimate business reasons to discuss the content of this white paper, as per the terms and conditions of your subscription agreement which you opted into in line with GDPR regulations and is an ongoing condition of subscription.
A host of analytical and business intelligence (BI) resources exist solely for keeping tabs on metrics.
But standard BI tools still have limitations.
For one, they don’t usually understand a large chunk of your free text service data, including details sourced directly from customer comments, call center agent notes, field technician debriefs, and machine log files. Standard BI tools make it challenging to access, analyze, or interpret unstructured data without a team of data scientists on standby.
Classic BI dashboards only display what’s currently happening within an organization based on past data, which is usually incomplete. The big picture remains obscured once again, making it difficult to use those insights to reach company goals and spot patterns that reveal likely future events. This can lead to the prioritization of unnecessary KPIs, or even worse, analysis paralysis.
Business leaders need total transparency and understanding of their current service landscape to succeed. And these can only be accomplished using tools that give you quick access to easy-to- read analyses that go beyond past trends, offering an idea of what is likely to happen in the future and providing prescriptive recommendations.
Leaders should be leveraging data-centric insights to create the most desired outcomes for their customers — ones that support growth and provide teams with the visibility and know-how to resolve any issues that arise.
Evaluating Performance With Standard KPIs Alone Creates Blind Spots
Most service organizations track KPIs, but too many narrowly focus on single measurements such as first time fix. Knowing the FTF rate is an important performance indicator, but when measured in a vacuum, it offers an incomplete or inaccurate snapshot of the health of your service organization.
Without zooming out for a 360-degree view, decisions that boost one KPI might lead to systemic and costly service issues. For example, how is team performance impacting customer satisfaction, or how are high first time fix rates driving up service costs?
It is beneficial to have a comprehensive understanding of service KPIs, including:
-
First time fix (FTF)
-
Mean time to resolution (MTTR)
-
Mean time between failure (MTBF)
By looking at these metrics in depth, you’ll gain deeper insight into every aspect of the service lifecycle, and see clear connections between performance and service outcomes.

This feature is just one short excerpt from a white paper published by Aquant.
www.fieldservicenews.com subscribers can read the full white paper now by hitting the button below.
If you are yet to subscribe you can do so for free by hitting the button and registering for our complimentary subscription tier FSN Standard on a dedicated page that provides you instant access to this white paper PLUS you will also be able to access our monthly selection of premium resources as soo as you are registered.
 Data usage note: By accessing this content you consent to the contact details submitted when you registered as a subscriber to fieldservicenews.com to be shared with the listed sponsor of this premium content Aquant who may contact you for legitimate business reasons to discuss the content of this white paper, as per the terms and conditions of your subscription agreement which you opted into in line with GDPR regulations and is an ongoing condition of subscription.
Further Reading:
- Read more about Aquant on Field Service News @ www.fieldservicenews.com/aquant
- Read more about Digital Transformation @ www.fieldservicenews.com/digital-transformation
- Read more about Leadership & Strategy @ www.fieldservicenews.com//leadership-and-strategy
- Learn more about Aquant @ www.aquant.io
- Follow Aquant on Twitter @ twitter.com/Aquant_io


 Field Service News is published by 1927 Media Ltd, an independent publisher whose sole focus is on the field service sector. As such our entire resources are focused on helping drive the field service sector forwards and aiming to best serve our industry through honest, incisive and innovative media coverage of the global field service sector.
Leave a Reply