


Aquant, has recently published the 2022 Service Intelligence Benchmark Report, now available at Field Service News, which offers an in-depth analysis of field service performance and customer satisfaction in a year of talent shortage, COVID service pivots, and shifting customer demands.
This feature is just one short excerpt from a report published by Aquant
www.fieldservicenews.com subscribers can read the full report now by hitting the button below.
If you are yet to subscribe you can do so for free by hitting the button and registering for our complimentary subscription tier FSN Standard on a dedicated page that provides you instant access to this white paper PLUS you will also be able to access our monthly selection of premium resources as soo as you are registered.

![]() Data usage note: By accessing this content you consent to the contact details submitted when you registered as a subscriber to fieldservicenews.com to be shared with the listed sponsor of this premium content Aquant who may contact you for legitimate business reasons to discuss the content of this white paper, as per the terms and conditions of your subscription agreement which you opted into in line with GDPR regulations and is an ongoing condition of subscription.
Data usage note: By accessing this content you consent to the contact details submitted when you registered as a subscriber to fieldservicenews.com to be shared with the listed sponsor of this premium content Aquant who may contact you for legitimate business reasons to discuss the content of this white paper, as per the terms and conditions of your subscription agreement which you opted into in line with GDPR regulations and is an ongoing condition of subscription.
In this comprehensive data report, Aquant analyzed how service organizations and their workforce measureD up against industry benchmarks.
We also explored service performance from a customer perspective. Aquant analyzed more than six million service tickets to reveal:
-
A snapshot of the overall industry and how companies measure up against each other
-
The reason why hitting your KPIs rarely equates to outstanding customer experiences
-
The spiraling impact of a missed First Time Fix (FTF) event
-
An increase in the workforce skills gap
-
COVID-19’s impact on service
We provide recommendations to:
-
Start making immediate business improvements by looking at service performance in a comprehensive way
-
Boost the customer experience in the short-term and long-term
-
Upskill a team in the face of a talent shortage
-
Succeed amid post-Covid service disruptions
KEY FINDINGS
KPIs Are Only as Meaningful As How You Measure Them
First Time Fix is a Distorted Barometer of Service Quality
Organizations that monitor KPIs in isolation may think they are hitting their numbers and providing great service. However, there’s a good chance that they are providing sub-par customer experiences.
Organizations that measure FTF rates at seven days or 14 days actually have much lower long-term success rates than their dashboards reveal. This is because fixes marked as complete on day one often require additional visits on day two through day 14 to fix a persistent problem that may have been incorrectly or inadequately addressed on the first visit. For example, if you wrap a leaking hose with duct tape to stop a leak, you’ve put a bandaid on a problem without fixing the root issue. The customer may call to reopen that ticket when they discover another leak in the following week.
-
86.6% is the FTF rates when measured in 7-day windows
-
81.5% is the FTF rates when measured in 14-day windows
-
75% is the FTF rates when measured in 30-day windows
The other argument against relying too heavily on FTF rates is that high values often mask other issues, such as:
-
Employees who shotgun parts to hit KPIs
- High labor costs due to labor to over-reliance on industry veterans
The way organizations provide service today is not in tune with customer expectations. Even with an average FTF rate, one in every four jobs requires at least one repeat visit.
Variations on FTF measurements are one reason for the disconnect. Other contributing factors include:
- Lack of insights into an organization’s core health
- A workforce labor shortage
- Inability to connect the dots between service performance and customer experience
- Reactive vs. proactive service
In 2021, service organizations faced even larger hiring challenges than in the past. This has left the industry with tens of thousands of unfilled jobs, and some reports estimate there will be an industry-wide shortage of three million skilled trade workers in the next five years.
-
The bottom quarter of the workforce costs organizations 84% more than the top quarter. That’s 4% higher than last year.
-
- The top 20% of the workforce (service heroes) has a 75% FTF rate. The bottom 20% of the workforce (service challengers) has a FTF rate of 59%.
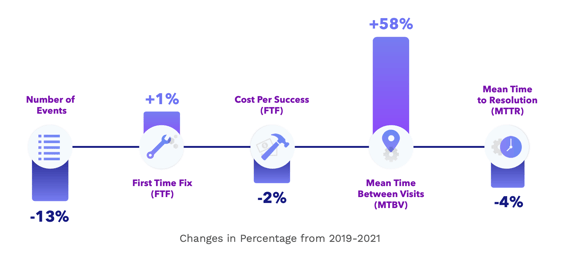
Mean Time to Resolution (MTTR) increased during COVID, showing that jobs were completed faster. Part of that increase is attributed to more service organizations adopting remote resolution technology. This technology helps customers address minor issues themselves through self-service solutions. It also enables service organizations to diagnose—and even repair—issues without the need to send a tech on-site, thus reducing time and costs.
This is also a sign of resiliency across service organizations, many of whom were able to adapt in the face of ever-changing circumstances.
The insights in this report, gleaned from actual service data, provides a path to service improvements through a multi-step process.
-
Learn how to accurately identify your organization’s core service problems by better understanding the patterns in your service data
-
Use those data patterns to drive actionable service recommendations—for management-level decisions and in-the-field fixes
-
Plan proactive customer experience enhancements
-
Make more informed workforce training and hiring decisions to shrink the skills gap
How We Compiled the Data
Aquant gathered and analyzed actual anonymized service data from more than 76 leading service organizations. The data in this report was measured before an organization deployed Aquant’s AI solution.
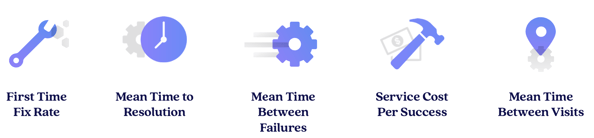
The report measures:
- 76 organizations, including service divisions within OEMs and third- party service organizations across manufacturing, medical devices, capital equipment, HVAC, commercial appliances, and more
- More than 6 million work orders
- More than 31,000 technicians
- $7 billion total in service costs
- An average of 3 years of service data per company
 How We Define the Service Workforce
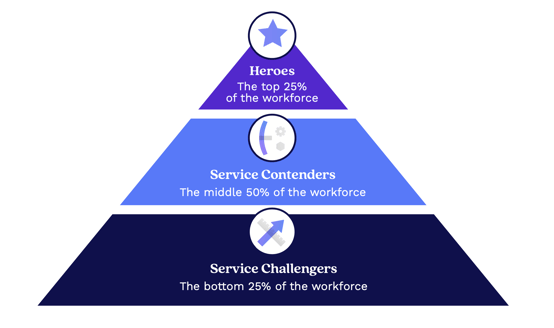 How is this Report Different from Standard Service Benchmarks?
• We analyzed real service data to understand the health and outlook of organizations instead of relying on service executives to self-report KPIs. Data sources included service tickets, CRM data, parts information, and more.
• We charted the skills gap. This makes it easy to extrapolate how much an organization can gain in efficiency and cost savings if the entire workforce was able to perform more like your experts.
• We analyzed the data using the Aquant Service Intelligence Platform, which includes a Natural Language Processing (NLP) engine built for the service industry. This lets us dig deep into data ranging from CRM and parts inventory to service tickets, handwritten records, and other information that never makes it into any databases. We are able to draw out patterns and recommendations based on raw data.
This feature is just one short excerpt from a report published by Aquant.
www.fieldservicenews.com subscribers can read the full report now by hitting the button below.
If you are yet to subscribe you can do so for free by hitting the button and registering for our complimentary subscription tier FSN Standard on a dedicated page that provides you instant access to this white paper PLUS you will also be able to access our monthly selection of premium resources as soo as you are registered.
![]() Data usage note: By accessing this content you consent to the contact details submitted when you registered as a subscriber to fieldservicenews.com to be shared with the listed sponsor of this premium content Aquant who may contact you for legitimate business reasons to discuss the content of this white paper, as per the terms and conditions of your subscription agreement which you opted into in line with GDPR regulations and is an ongoing condition of subscription.
Data usage note: By accessing this content you consent to the contact details submitted when you registered as a subscriber to fieldservicenews.com to be shared with the listed sponsor of this premium content Aquant who may contact you for legitimate business reasons to discuss the content of this white paper, as per the terms and conditions of your subscription agreement which you opted into in line with GDPR regulations and is an ongoing condition of subscription.
Further Reading:
- Read more about Aquant on Field Service News @ www.fieldservicenews.com/aquant
- Read more about Digital Transformation @ www.fieldservicenews.com/digital-transformation
- Read more about Leadership & Strategy @ www.fieldservicenews.com//leadership-and-strategy
- Learn more about Aquant @ www.aquant.io
- Follow Aquant on Twitter @ twitter.com/Aquant_io


 Field Service News is published by 1927 Media Ltd, an independent publisher whose sole focus is on the field service sector. As such our entire resources are focused on helping drive the field service sector forwards and aiming to best serve our industry through honest, incisive and innovative media coverage of the global field service sector.
Leave a Reply