


Aquant, has recently published the 2022 Service Intelligence Benchmark Report, now available at Field Service News, which offers an in-depth analysis of field service performance and customer satisfaction in a year of talent shortage, COVID service pivots, and shifting customer demands. In this excerpt from the report, we look at what KPIs do and don't tell us.
This feature is just one short excerpt from a report published by Aquant
www.fieldservicenews.com subscribers can read the full report now by hitting the button below.
If you are yet to subscribe you can do so for free by hitting the button and registering for our complimentary subscription tier FSN Standard on a dedicated page that provides you instant access to this white paper PLUS you will also be able to access our monthly selection of premium resources as soo as you are registered.

![]() Data usage note: By accessing this content you consent to the contact details submitted when you registered as a subscriber to fieldservicenews.com to be shared with the listed sponsor of this premium content Aquant who may contact you for legitimate business reasons to discuss the content of this white paper, as per the terms and conditions of your subscription agreement which you opted into in line with GDPR regulations and is an ongoing condition of subscription.
Data usage note: By accessing this content you consent to the contact details submitted when you registered as a subscriber to fieldservicenews.com to be shared with the listed sponsor of this premium content Aquant who may contact you for legitimate business reasons to discuss the content of this white paper, as per the terms and conditions of your subscription agreement which you opted into in line with GDPR regulations and is an ongoing condition of subscription.
WHAT KPI MEASUREMENTS DO AND DON'T TELL US
KPIs don't equal customer sentiment
In the Service Leader’s Guide to Workforce KPIs, we examined why workforce measurement is more critical than ever, and we defined best practices for measurement criteria.
For the 2022 Service Intelligence Benchmark Report, we went a step further. We analyzed service data to understand service performance beyond KPI measurement. We found that knowing your KPIs—by number or average performance—is not the same as understanding what those numbers reveal about customer satisfaction, employee skill level, or overall service performance. Averages don’t disclose the specific details you need to make critical service decisions.
Service KPIs by the numbers
Here’s the breakdown of how service organizations measure up against other organizations and the industry as a whole.
FTFR - First Time Fix Rate
What is it?
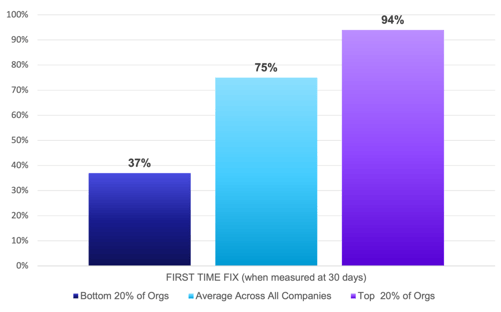
First Time Fix rate is one of the most popular metrics for workforce measurement. It indicates how often someone is able to fix an issue on the first try. In this report, we are measuring the FTF rate of field visits, in a 30-day window.
Key Observation:
FTF rates have hovered around 75% for more than a decade—and remained stagnant for all but a handful of top-performing companies. Additionally, FTF rates should never be measured in isolation. On average, a failed first visit leads to 2.5 additional visits and 20 days for MTTR.
CPS - Cost Per Success
What is it?
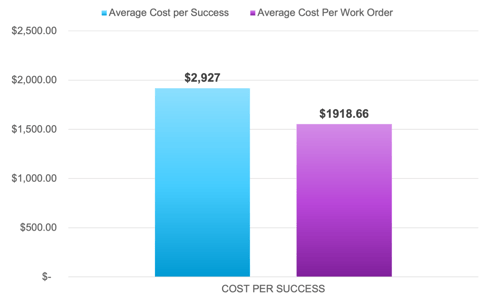
The total amount required to successfully close a service ticket is known as the Cost Per Success (CPS). This is a bit different from other similar-sounding KPIs, such as Cost Per Truck Roll, since total CPS may include multiple visits, multiple truck rolls, a variety of parts, and other labor costs.
Some organizations may measure Cost Per Work Order, but that metric leaves out cases that include always assigning experts to the most complex (and expensive) jobs. Additionally, it does not account for cases where multiple work orders are related to the same core issue.
Key Observation:
Successfully resolving an issue involves nearly 42% more in costs versus looking at work orders individually. While average costs are dependent on the company and type of equipment being serviced, the cost difference is the most important to keep in mind.
MTTR - Mean Time to Resolution
What is it?
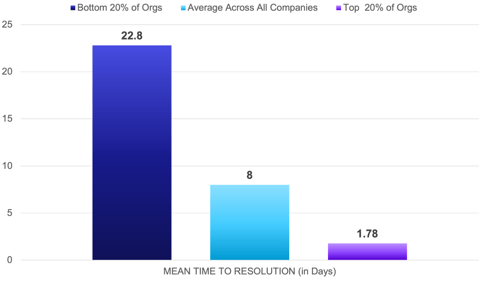
The Mean Time to Resolution KPI measures the time it takes to resolve a customer issue. Typically, it’s the time between the case creation date and the closure date. Similar to the pain of staying on hold when trying to resolve a personal issue, minimizing MTTR is a key factor in increasing positive customer experiences and reducing service costs. In the last year, we’ve seen a growing divide in this metric.
MTTR (in days):
• 8 days: average across all companies• 1.78 days: top 20% of organizations• 22.8 days: bottom 20% of organizations
MTBF - Mean Time Between Failures
What is it?
Mean Time Between Failures quantifies the average time between customer issues. Service organizations try to maximize this metric because a higher rate represents excellent service quality and maximum uptime.
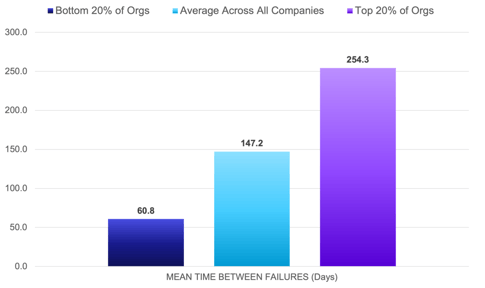
• 139.9 days: Average across all companies (147.2 in 2021)
• 231.8 days: Top 20% of organizations (254.3 in 2021)
• 57.5 days: Bottom 20% of organizations (60.8 in 2021)
Key Observation:
Individual pieces of equipment may have differing life cycles, but service leaders need to understand underlying patterns—in both their machines and workforces. When visiting a job site, experienced service heroes know how to use their time wisely and ensure that assets are working properly before leaving. This can significantly extend the time between failures.
MTBV - Mean Time Between Visits
What is it?
Need to calculate both uptime and service performance? Look no further than the Mean Time Between Visits metric. This measures every visit you have for an asset or customer, instead of only tracking time between failures.
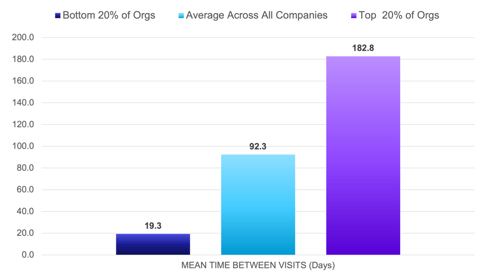
• 92.3 days: average across all companies
• 182.8 days: top 20% of organizations
<• 19.28 days: bottom 20% of organizations
Key Observation:
Experienced techs will skew towards longer time intervals between visits. That’s great news, thanks to low repeat visit rates, as well as their ability to utilize every visit to maximize uptime.
This feature is just one short excerpt from a report published by Aquant.
www.fieldservicenews.com subscribers can read the full report now by hitting the button below.
If you are yet to subscribe you can do so for free by hitting the button and registering for our complimentary subscription tier FSN Standard on a dedicated page that provides you instant access to this white paper PLUS you will also be able to access our monthly selection of premium resources as soo as you are registered.
![]() Data usage note: By accessing this content you consent to the contact details submitted when you registered as a subscriber to fieldservicenews.com to be shared with the listed sponsor of this premium content Aquant who may contact you for legitimate business reasons to discuss the content of this white paper, as per the terms and conditions of your subscription agreement which you opted into in line with GDPR regulations and is an ongoing condition of subscription.
Data usage note: By accessing this content you consent to the contact details submitted when you registered as a subscriber to fieldservicenews.com to be shared with the listed sponsor of this premium content Aquant who may contact you for legitimate business reasons to discuss the content of this white paper, as per the terms and conditions of your subscription agreement which you opted into in line with GDPR regulations and is an ongoing condition of subscription.
Further Reading:
- Read more about Aquant on Field Service News @ www.fieldservicenews.com/aquant
- Read more about Digital Transformation @ www.fieldservicenews.com/digital-transformation
- Read more about Leadership & Strategy @ www.fieldservicenews.com//leadership-and-strategy
- Learn more about Aquant @ www.aquant.io
- Follow Aquant on Twitter @ twitter.com/Aquant_io


 Field Service News is published by 1927 Media Ltd, an independent publisher whose sole focus is on the field service sector. As such our entire resources are focused on helping drive the field service sector forwards and aiming to best serve our industry through honest, incisive and innovative media coverage of the global field service sector.
Leave a Reply